PORTFOLIO OF MY DESIGNS
Please scroll down or a press button for more designs.
Portals:
Please scroll down or a press button for more designs.
Portals:
DATA VISUALIZATION DESIGNS:
Uber and Lyft Trips in Boston, Nov to Dec 2018
Designed in Apr 2020
Click on the buttons to filter.
** Line widths not to scale.
Dataset source from Kaggle: https://www.kaggle.com/brllrb/uber-and-lyft-dataset-boston-ma/data
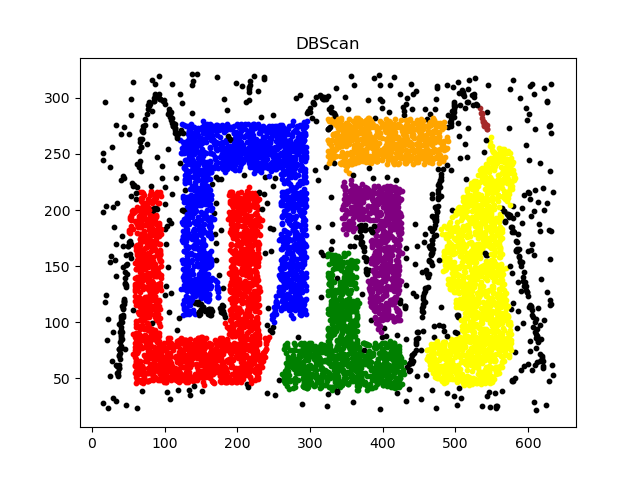
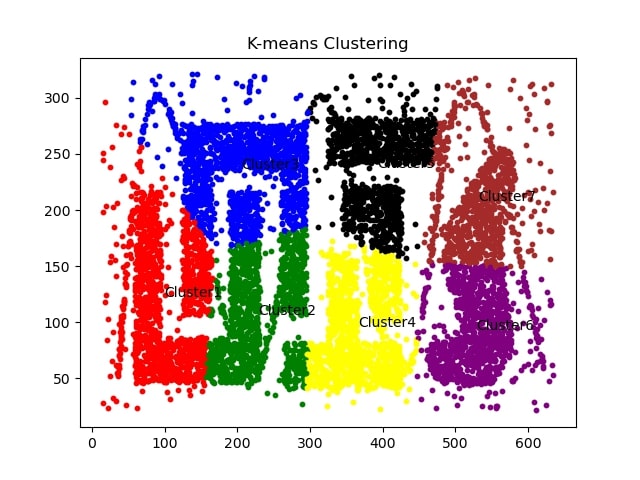
DBScan vs K-means Clustering
Designed in Apr 2020